Data & chartsDados & gráficos
ApexChartsApexCharts
JavaScript library for interactive charts in web appsBiblioteca JavaScript de gráficos interativos para web apps
What it isO que é
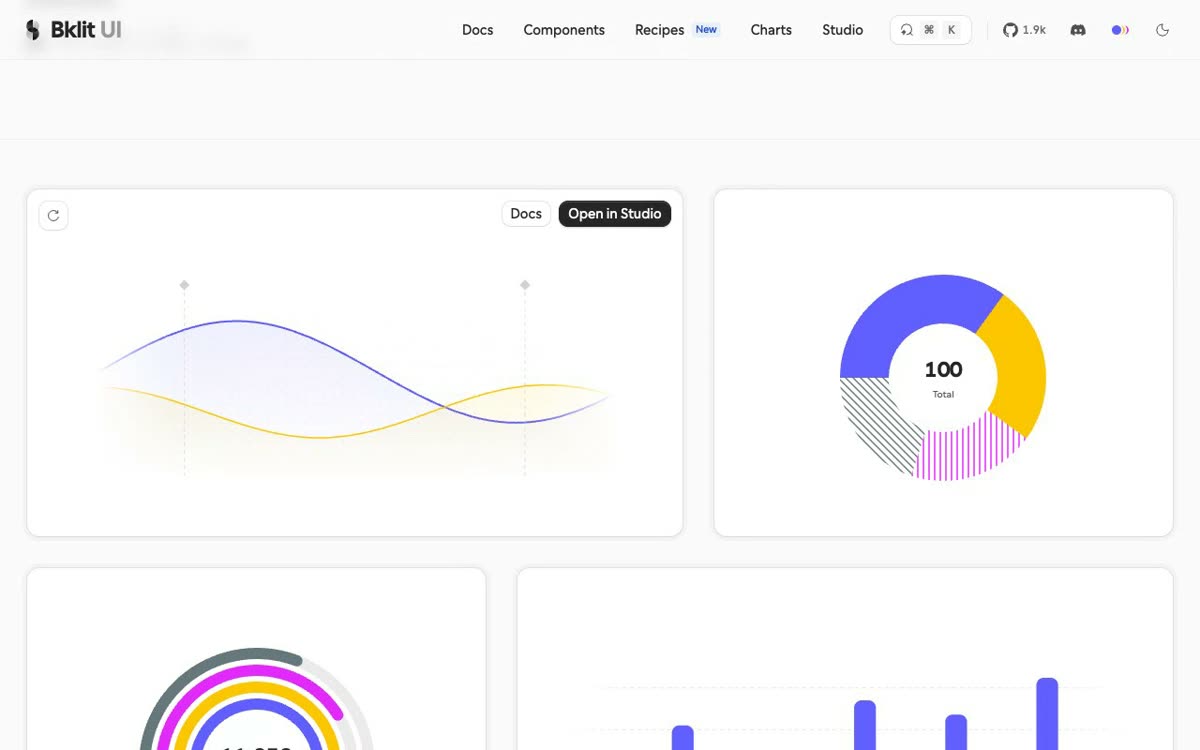
ApexCharts.js is a library of interactive charts configured through options, with no manual drawing code. It works with React, Vue, Angular, Blazor and plain JavaScript.
ApexCharts.js é uma biblioteca de gráficos interativos configurados por opções, sem código de desenho manual. Funciona com React, Vue, Angular, Blazor e JavaScript puro.
What it’s forPara que serve
For putting interactive charts and dashboards in an app, with tooltips, hover and update animation built in.
Para colocar gráficos e dashboards interativos em um app com tooltips, hover e animação de atualização prontos.
BenefitsVantagens
- Many types: line, area, bar, candlestick, heatmap, treemap, radar, gauge and sparklines
- Built-in tooltips and hover states; charts animate when data updates
- MCP server and skills files for coding assistants
- Muitos tipos: linha, área, barra, candlestick, heatmap, treemap, radar, gauge e sparklines
- Tooltips e estados de hover embutidos; gráficos animam ao atualizar os dados
- Servidor MCP e arquivos de skills para assistentes de código
CaveatsRessalvas
- According to the maker, a line chart with 100,000 points renders in 29 ms, in its own benchmark.
- Offered under community and commercial licenses; terms and pricing are on separate pages.
- Segundo o fabricante, um gráfico de linha com 100 mil pontos renderiza em 29 ms, em benchmark próprio.
- Oferecida em licenças comunitária e comercial; termos e preços estão em páginas à parte.