Data & chartsDados & gráficos
Bklit UIBklit UI
Chart and data visualization library, with skills for agentsBiblioteca de gráficos e visualização de dados, com skills para agentes
What it isO que é
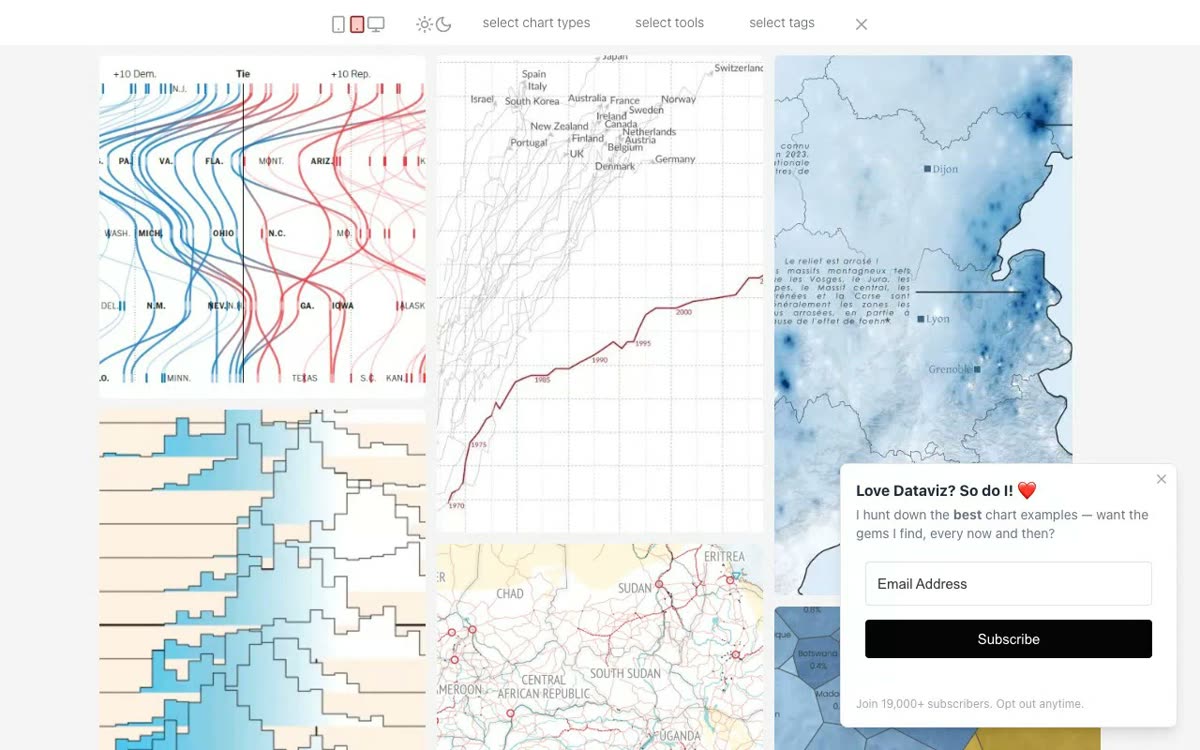
Bklit UI is a library of chart and data visualization components. The site advertises 211 charts in 19 types, and there are integration, design and migration skills.
Bklit UI é uma biblioteca de componentes de gráficos e visualização de dados. O site anuncia 211 gráficos em 19 tipos e há skills de integração, design e migração.
What it’s forPara que serve
For building charts in interfaces, or migrating from Recharts or Tremor, letting an agent integrate and design with the skills in the documentation.
Para montar gráficos em interfaces, ou migrar de Recharts ou Tremor, deixando um agente integrar e desenhar com as skills da documentação.
BenefitsVantagens
- 211 charts in 19 types, such as area, bar, candlestick, heatmap and sankey
- Integration, design and migration skills
- Docs, component catalog, recipes and blocks
- 211 gráficos em 19 tipos, como área, barra, candlestick, heatmap e sankey
- Skills de integração, design e migração
- Docs, catálogo de componentes, receitas e blocos
CaveatsRessalvas
- The name is sometimes spelled "Backlit UI"; the correct one is Bklit.
- Price and license aren't on the home page.
- O nome às vezes aparece escrito "Backlit UI"; o correto é Bklit.
- Preço e licença não estão na página inicial.