Data visualization and charts
Chart libraries and data tools for clear, good-looking charts on the web. Each card says what kind of chart it does well and what to borrow from it.
6 references · Updated
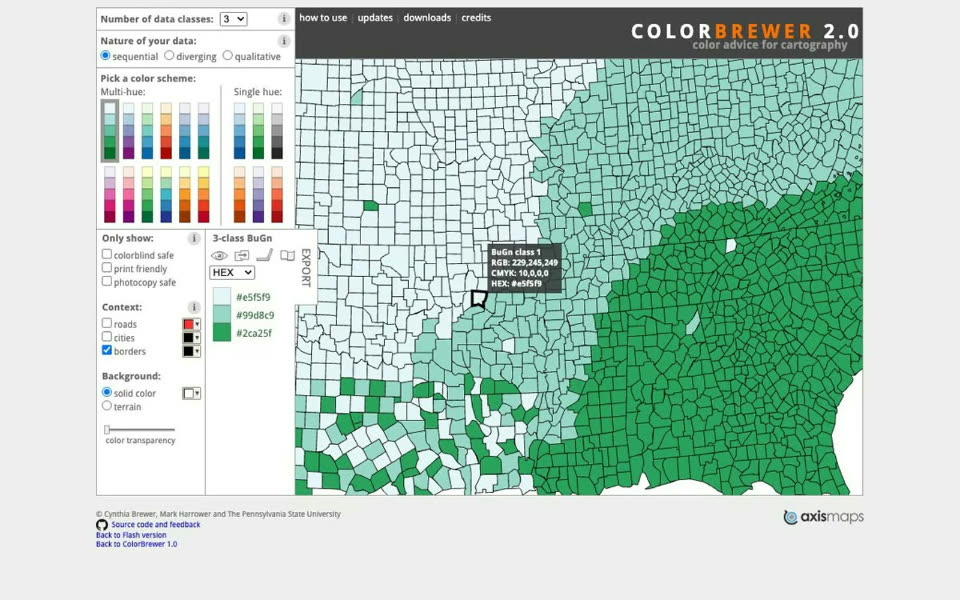 ColorBrewer 2.0Data & chartsSequential, diverging and qualitative palettes for maps and charts, with accessibility options.
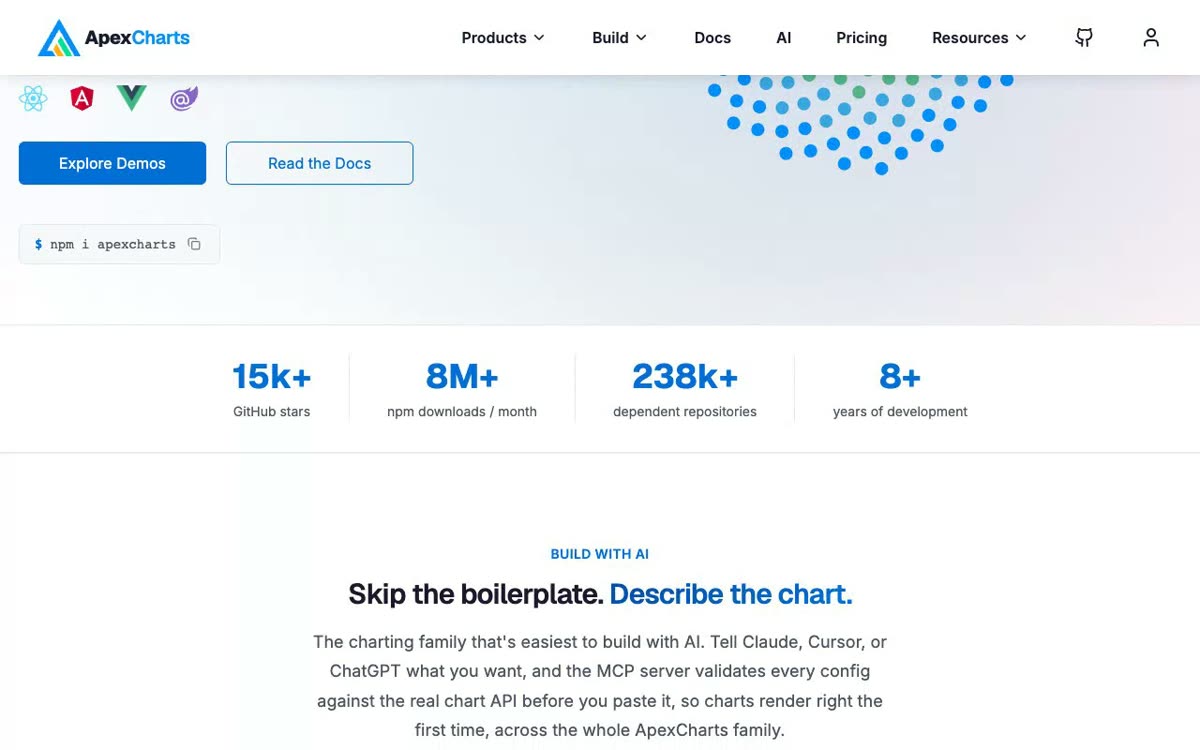 ApexChartsData & chartsInteractive charts set up through options, with tooltips and update animations, in any framework.
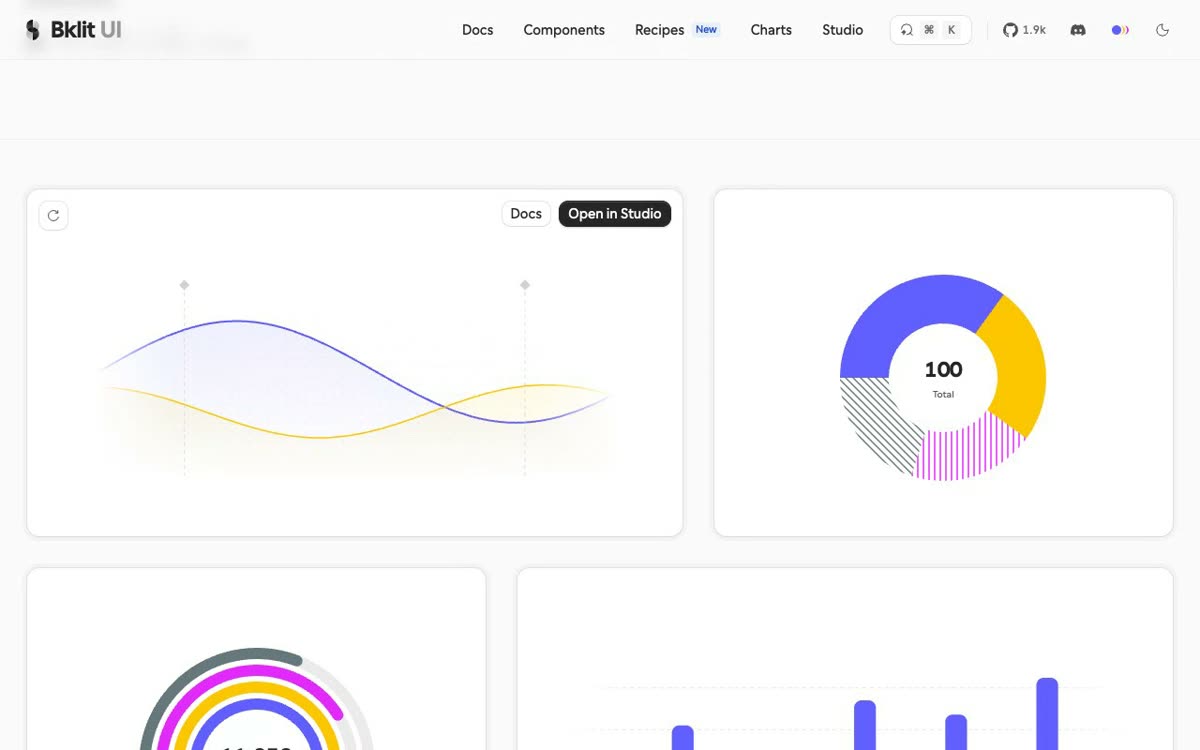 Bklit UIData & chartsChart components for interfaces, plus skills so an agent integrates or migrates from Recharts.
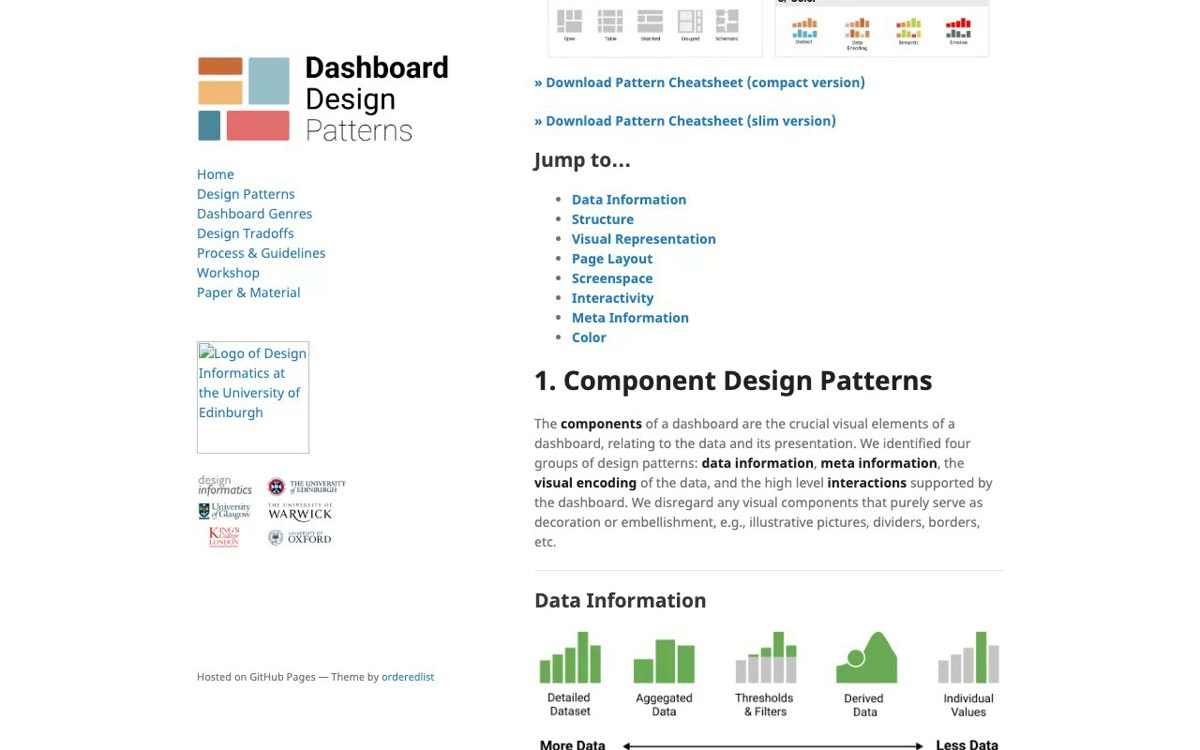 Dashboard Design PatternsData & chartsA catalog of dashboard patterns for structure, layout, visual representation and color.
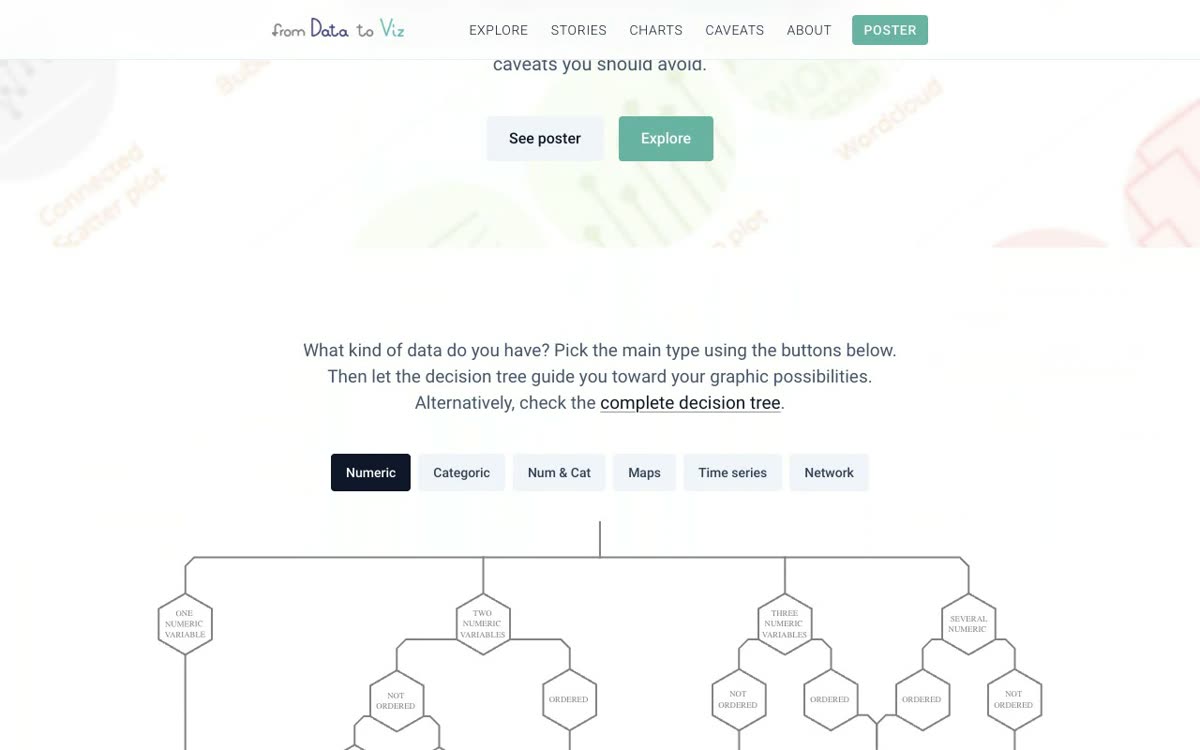 From Data to VizData & chartsA decision tree: pick your data type, get suitable chart types and the code to draw them.
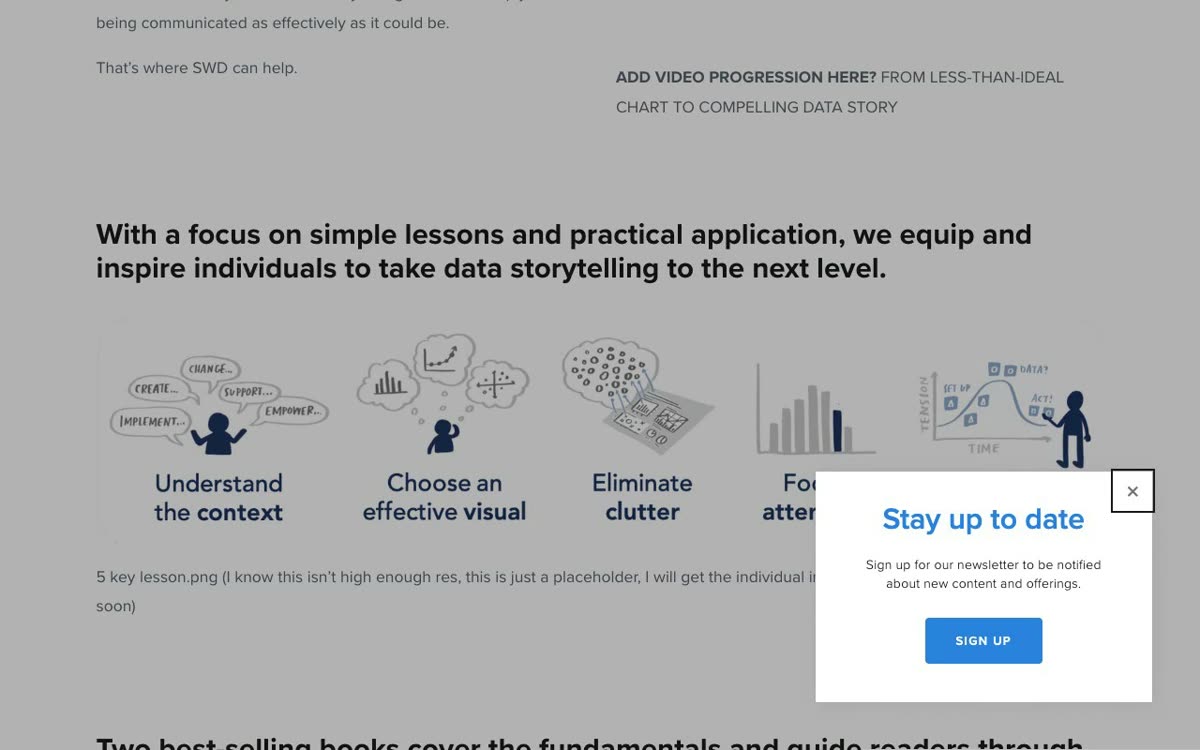 Storytelling with DataData & chartsRedesigned charts and a chart guide for presenting data clearly, plus books, workshops and a blog.